.
The need for more efficient and accurate system monitoring increases as technology evolves. Traditional system monitoring provides only limited visibility into your system, making it difficult to identify and resolve errors when they occur. This is where observability comes in.
It’s a new approach to systems monitoring that gives you greater visibility into performance and can help you quickly identify and resolve issues.
In this article, we explain what observability is and why you should use it. Follow!
What is observability?
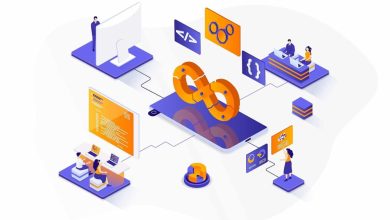
Observability is the ability to understand the internal state of a system by capturing and analyzing its outputs. It involves collecting, visualizing and applying intelligence to metrics, traces, logs and events to understand the behavior of a complex system.
Observability allows teams to:
- monitor modern IT systems more efficiently;
- identify and connect effects in a complex chain, allowing you to trace them back to their cause;
- have visibility across the architecture—especially for system administrators, IT operations analysts, and developers.
What is the difference between observability and monitoring?
Monitoring uses dashboards to capture and display predetermined data that helps IT teams spot potential issues and long-term performance trends. However, while it notifies DevOps teams of operational issues using alerts, it does not identify the individual component or the underlying reason behind the problem, especially in a highly complex distributed system.
On the other hand, observability provides insights and comprehensively assesses the entire IT environment using data collected from each internal system. This granular, contextual insight it provides can help teams understand, identify, and troubleshoot the root cause of IT infrastructure issues. Thus, it serves as a knowledge base for engineers to define what they want to monitor and how to improve performance.
To summarize the difference between observability and monitoring, monitoring tells you what is wrong, while observability answers the how and why of the error. So it’s best to see both as complementary strategies for providing robust information about your IT infrastructure, because monitoring alone notifies you of what is broken, but not why.
What are the three pillars of observability?
Achieving observability requires implementing three classes of data known as the “pillars” of observability. Let’s explain each of them.
Logs
A log is a written record of a specific event, describing what happened and when. Logs contain details such as timestamps and payloads to provide important context for analysis.
There are three types of logs: binary, structured, and plain text logs. Plain text logs are most commonly used, although structured logs are gaining in popularity due to the addition of queryable metadata. Logs are often the first resort when investigating a system issue.
Metrics
a metric is typically a numerical value tracked over time, used to measure the state or performance of a system. Metrics include attributes such as names, timestamps, and KPIs to provide context.
Metrics differ from logs in that they have a standard structure and are easy to optimize for storage. They are also easy to query and allow analysts to track changes to a specific element over time.
Tracking
Tracing is the mapped journey of a given request across a distributed system. It encodes the relevant data for each operation performed on the request (or “span”) as it moves through the system. It can include single or multiple spans, allowing you to track the progress of a request through the microservices system to find bottlenecks and the cause of a failure.
As part of a comprehensive observability strategy, logs, metrics, and traces can help you identify issues, understand why they occur, and resolve them quickly.
What are the benefits of applying observability to your processes?
IT, SRE, development, and operations teams can gain tremendous benefits by implementing observability in their applications. Here are some of the main ones.
Increases visibility
Clear visibility into applications has become increasingly difficult as organizations lean towards complex distributed systems. Observability gives you the visibility you need to resolve issues faster before they affect your customer. Enhancing the end-user experience can increase revenue, improve customer loyalty, and streamline your process.
Improves debugging
Observable systems allow developers to track requests from start to finish with contextualized data along the way. This additional information along the user journey allows IT specialists to fix and debug issues faster when your system fails.
Improves user experience
Developers can detect latency occurring in their distributed services faster than ever thanks to observability platforms. The ability to do this makes your users’ experience better, and in turn, can improve your company’s reputation and lead to loyal customers.
updates alert
Observation capability helps you find the most relevant performance issues faster than ever with notification alerts. These alerts help IT professionals troubleshoot issues, reduce unnecessary noise, and find the root of any problem in a shorter amount of time than before.
Optimize business strategy
Full analytics and real-time data to improve your organization’s plans and accelerate conversion rates. Understanding the impacts of different IT releases will help provide you with contextual data to know if you are meeting your business goals.
Spend less time trying to find the root cause of application errors and improve your software integrity with observation capability.
How do you make a system observable?
Now that you have a deep understanding of what observability is and how it can benefit your business, you’re probably wondering how I can make my system observable.
Achieving observability is much more than just collecting telemetry data from your digital system. You need the right tools to get the information you need and add additional context to find solutions to errors.
There are five key components to a successful implementation of observability.
Instrumentation
Instrumentation tools use open source telemetry data or vendor-specific platforms to provide visibility into your infrastructure.
Distributed tracking
This is an essential aspect of observability because distributed tracing shows how a system’s internal microservices are interconnected and maps each user request.
incident response
Your observability platform should have an alert management system that informs the right IT staff when issues arise.
data correlation
Processing and correlating telemetry data adds the context needed to transform it into charts and tables. These visualizations will help your team get a complete picture of the data collected and understand any peaks and troughs during a time series.
AIOps
Machine learning models automate IT operations such as aggregating, correlating and prioritizing incident data. AIOps tools help accelerate incident response and improve mean time to prevent (MTTR).
In summary, the value of observability comes from its organizational impact. As systems become more complex, having an observability platform to keep pace with managing cloud-native environments, microservices and dynamic containers, distributed systems, and more is critical.
Did you like this article and want to follow other content about technology, IT management and business? Subscribe to our newsletter and receive our news periodically in your email.
.


